Open data on financing, coverage and accountability
Every indicator the project tracks, published for government, partners and citizens alike. Reports are built in Power BI and embedded on this page so anyone can explore them without a licence.
- Reporting period: April 2026 to date
- Last updated: 12 October 2026
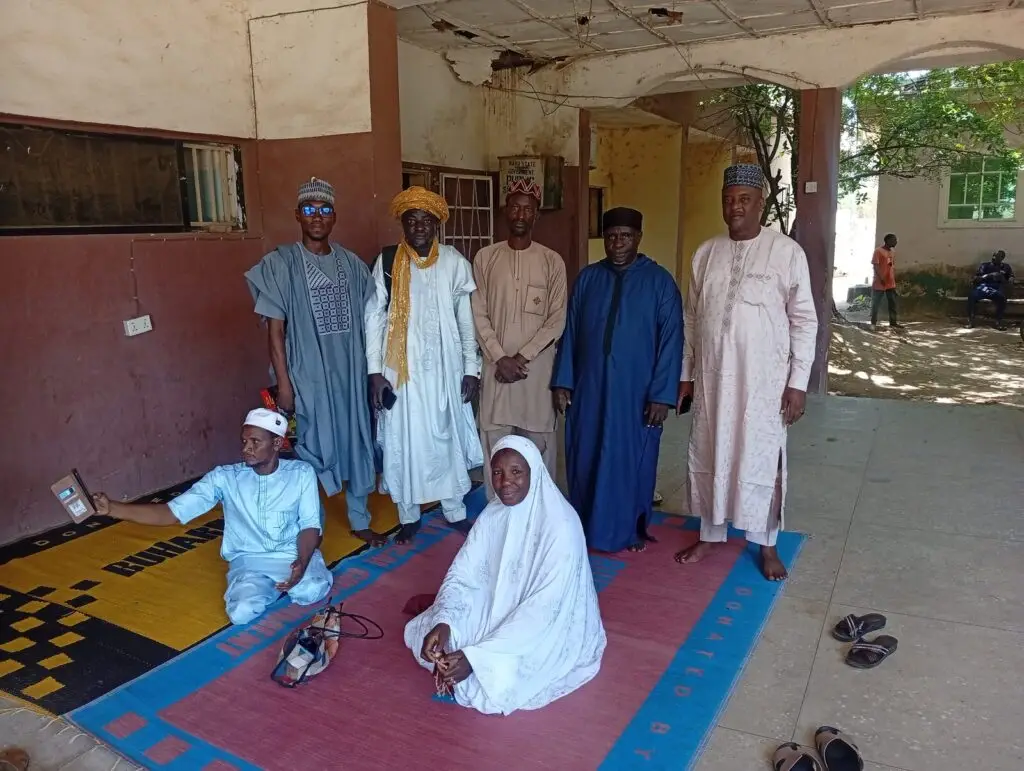
- Sources: ICSA facility assessments and client exit interviews across 42 LGAs (CommCare), compiled by the consortium MEL team
Selected public indicators
52.4%
64.3%
59.5%
86.1%
35.7%
1,062
Best viewed in landscape on phones. Use the report’s own page tabs to move between views.
How to read the dashboard
How to read it
Use the filters inside the report to focus on a state or period. Hover any bar or point for the exact value; switch to the table view for a screen-reader friendly layout.
Where the data comes from
Data quality notes
Coverage and scorecard indicators refresh monthly; financing indicators refresh each quarter after state releases are confirmed. Figures are provisional until the quarterly review signs them off.
What is not included
The public dashboard shows programme-level and state-level indicators only. Facility-level records, beneficiary information, internal monitoring data and donor reporting are not published here.
Update cycle
Coverage and scorecards refresh monthly; financing refreshes each quarter after state releases are confirmed. Quarterly digital reports are archived under Resources.
Open data licence
Published datasets and reports are released under a Creative Commons Attribution licence unless stated otherwise. Cite ICSA and the reporting period when you reuse them.
Downloadable data and related publications
Datasets and reports are published here after each quarterly review.